Methodology
The Climate Atlas tool was developed by Conservation Science Partners in 2021. The project background and methodology are summarized briefly below, followed by specific data uses and limitations of the tool.
For more detail, see the peer-reviewed Technical Report.
Background
To mitigate the impacts of climate change and stem the loss of biodiversity, scientists have recommended substantial increases in the amount of protected land area. This has led to calls for ambitious new protection targets, among them the Biden administration’s commitment to protecting 30 percent of U.S. public lands by 2030.
Achieving these ambitious targets will require protecting millions of acres of public lands managed by the Bureau of Land Management and the U.S. Forest Service, two of the country’s largest land management agencies.
However, prioritizing which acres of public land to protect remains a considerable challenge. This is because of multiple objectives for using the land as well as the wide range of ecological and environmental benefits that a given landscape might provide – including storing carbon, providing habitat for wildlife, and enabling ecological connectivity. There are also potential trade-offs among these co-benefits.
60% of land in the continental U.S. is in a natural state, but we are losing a football field worth of it every 30 seconds.
Only 13% of U.S. lands are permanently protected.
Source: Conservation Science Partners
What Makes The Climate Atlas Unique
The Climate Atlas builds on previous research and current efforts to identify and prioritize high-value landscapes for climate mitigation and biodiversity protection.
The tool adds to this work in four novel and important ways:
- It focuses on climate and biodiversity.
- It includes Alaska, which is not often included in data analyses of this kind.
- It uses a rigorous modeling approach to combine indicators.
- It’s designed to directly meet user needs.
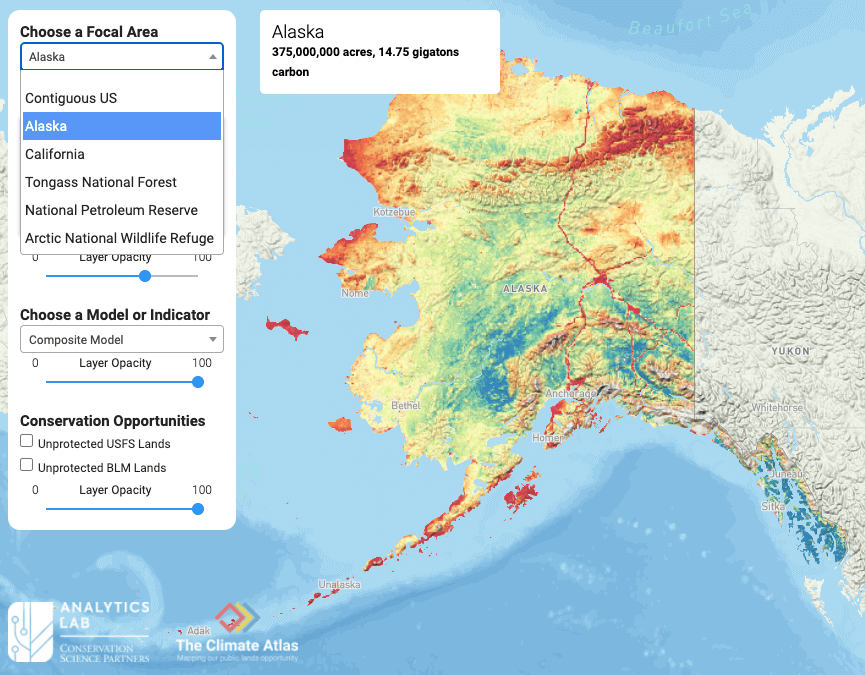
The Climate Atlas, with focal area showing Alaska
Methodology
To address the challenge of identifying which public lands to protect, The Climate Atlas integrates multiple ecological and environmental variables (a total of six indicators) into a set of three models. Each of these models provides a measure of conservation value. The models cover the area of the lower 48 U.S states plus Alaska.
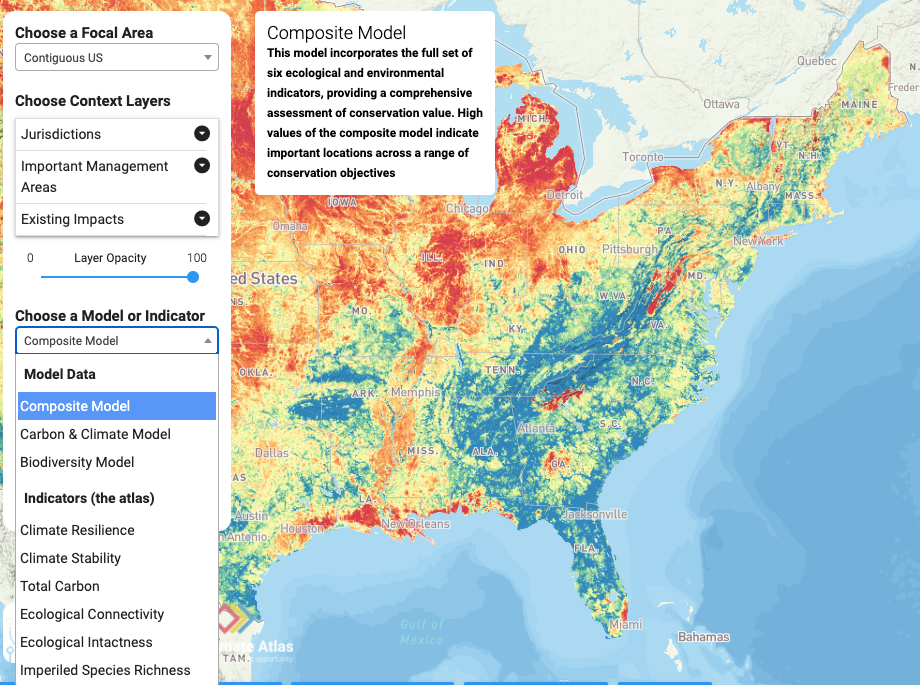
The Climate Atlas, with model & indicator options displayed
The three models are:
- preserving biodiversity
- mitigating climate change, and
- quantifying overall conservation value by balancing biodiversity and climate considerations.
The models and indicators were developed in collaboration with project partners and stakeholders, with the goal of leveraging the best available science to meet diverse resource management and policymaking needs.
These data layers were then incorporated into an open-access, web-based tool designed to enable managers, planners, decision makers, and others to examine the estimated conservation value of a given location, along with the ecological and environmental variables (indicators) driving that value.
The six indicators
The six underlying indicators were selected to reflect key or emerging conservation priorities related to the protection of biodiversity and the mitigation of climate change. They were developed using the most recent available data at the highest spatial resolution obtainable. The six indicators are:
Total Carbon
Total Carbon is the total ecosystem carbon (above- and below-ground biomass, soil organic carbon) that currently exists in a given location. This dataset is based on the best available information on current carbon storage across the U.S.
Climate Resilience
Climate Resilience is the degree to which the current climate conditions in a given location will be accessible in the future. Areas of high climate resilience are those that contribute to the ability of organisms to adapt to climate change through both local and long-distance movements.
Climate Stability
Climate Stability is the similarity between the present climate (averaged between 1981 and 2010) and future climate (in 2055) at a given location. Climatically stable areas will have future climates that are similar to present conditions.
Ecological Intactness
Ecological Intactness is the degree to which a given location remains in a natural state. Ecologically intact landscapes have minimal or no influence from human activities and are therefore able to support natural evolutionary and ecological processes as well as communities of organisms similar in species composition, diversity, and functional organization to those of undisturbed habitats.
Species Richness
Species Richness is the total number of species likely to occur in a given area. For the lower 48 U.S. states, the dataset uses habitat suitability maps for 2,216 of the nation’s most imperiled species, including vertebrates, freshwater invertebrates, pollinators, and vascular plants. For Alaska, the dataset incorporates range maps for 330 terrestrial vertebrate species.
Ecological Connectivity
Ecological Connectivity is the ability of a given location to support the natural movement of organisms through processes such as dispersal, migration, and gene flow, and to provide linkages between areas of high-quality habitat. Maintaining areas of high ecological connectivity is considered a key strategy for supporting species migrations and range shifts under climate change.
The three models
Combinations of the six indicators described above were integrated into three models, with each model providing a single estimate of conservation value for each location (pixel) covered in The Climate Atlas tool. The models serve as a way to synthesize complex ecological and environmental data into a single, easily understood metric. They provide the flexibility to compare and contrast priority areas based on a range of conservation values and desired outcomes.
Each of the three models addresses a unique set of conservation objectives:
Composite Model
The Composite Model incorporates all six indicators described above to provide a comprehensive assessment of conservation value across the lower 48 U.S. states and Alaska.
Carbon & Climate Model
The Carbon & Climate Model emphasizes areas important for mitigating the impacts of climate change. It includes the three climate-related indicators: total carbon, climate resilience, and climate stability.
Biodiversity Model
The Biodiversity Model emphasizes areas important for maintaining connected ecosystems and mitigating species loss. It includes the three ecological indicators: ecological connectivity, ecological integrity, and either imperiled species richness (lower 48 U.S. states) or vertebrate species richness (Alaska).
Results summary
Mapping the three models across the lower 48 U.S. states and Alaska makes it possible to identify different potential priority areas for protection, depending on the model used.
As described above, each model represents distinct conservation objectives: for example, varying regions could be identified as “high value” for mitigating the impacts of climate change versus for protecting biodiversity.
One advantage of the composite model is that it balances both biodiversity and climate objectives and can be used to identify areas that are important for both. Taking conservation actions in these priority areas might provide a variety of benefits for both climate mitigation and biodiversity.
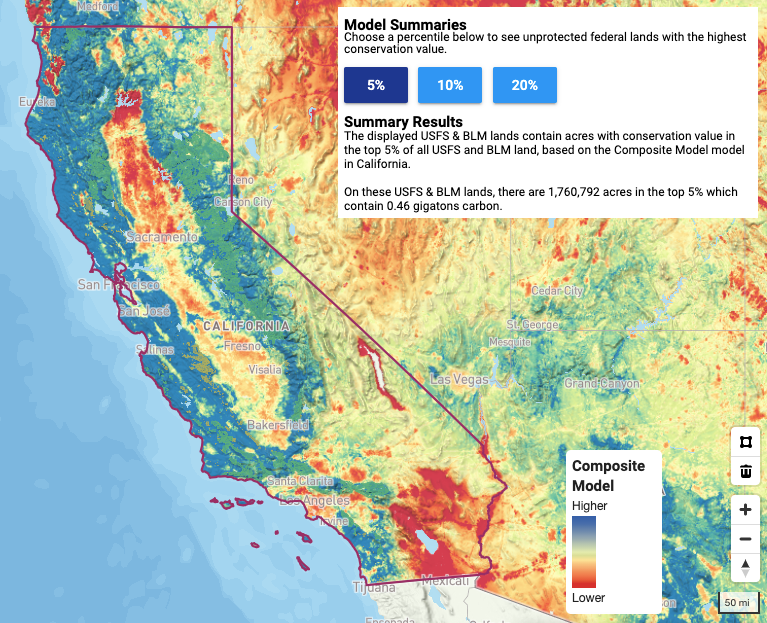
The Climate Atlas, showing summary results
Data Uses
The data provided in The Climate Atlas are intended to be used to inform the identification and prioritization of high-value public lands in the lower 48 U.S. states and Alaska. Through the tool, users can identify the top areas required to achieve their particular targets, in terms of acreage or percent of land area protected.
Data availability and relevance
The three models were derived from input layers that reflect what was determined to be the best available data at the time of the tool’s development. The contextual data on existing public land protections are updated on an annual basis and may not reflect more recent changes. Because the input layers use varying resolutions, the data will be most relevant for landscape-scale, coarse-filter assessments, and may be unsuitable for finer-scale, localized analyses.
Area coverage
To facilitate landscape-scale analyses that are relevant to management decision-making, The Climate Atlas highlights federal lands containing pixels in the top percentiles of each of the three composite models. The high-value pixels in these top percentiles represent a minimum 5,000-acre area of high conservation value.
Digging deeper
In addition to examining the results of the three models, we encourage users to explore and compare patterns based on the six individual indicator layers themselves. Even where one or all of the models suggest low aggregate conservation value, one or more of the underlying indicators might be high, underscoring that most places have at least some conservation value. Several of these indicator layers are likely to be highly relevant to decision making, depending on user objectives and priorities. Of the three models provided, the combined composite model offers the most comprehensive measure of the overall conservation value of a given landscape.
Limitations
All three of the models represent numerical representations of values and objectives rather than a statistical quantification of some measurable phenomenon. The model results will depend on the exact indicators used and the relative importance values that they are assigned.
- We have endeavored to: 1) choose a comprehensive set of indicators that reflect a range of conservation goals based on partner need and expertise, and 2) ensure that all indicators have equal influence in determining the value of the resulting index. However, we acknowledge that these decisions may not reflect the specific goals or values of all users.
- We caution users to assess the suitability of the data for the question of interest, and to consider any scale-dependent limitations in the data that may affect their applicability or interpretation. In particular, the data resolution of the indicator layers for climate resilience and climate stability may be too coarse to evaluate finer-scale climatic variability.
- We also acknowledge sources of potential uncertainty in the indicator layers, including variability in spatial and temporal scales and potential error in modeled pixel values.
Referencing The Climate Atlas
We recommend that any publications or applications drawing on the data contained in The Climate Atlas be undertaken in consultation with the creators of the tool. This includes publication in novel analyses, reports, peer-reviewed articles, theses, or other forms.
The data used in The Climate Atlas come from many diverse sources, as referenced in the Technical Report. When citing this report, please use the guidance below:
Recommended Citation: Conservation Science Partners. 2021. Informing the identification and protection of public lands to help mitigate the impacts of climate change and biodiversity loss in the United States. Technical Report. Truckee, CA.
Read the Technical Report
For further detail on the background, methodology, and data uses and limitations in The Climate Atlas tool, please see the peer-reviewed Technical Report.